Noisy Stars: Rating Reliability and the Superhost Premium
Note: This research was conducted during Summer 2026 with Muhlenberg undergraduate student researcher, Judah Dasebre.
Schematic listings; the 4.8 line and 0.37 are the study's.
Overview
Airbnb awards its Superhost badge partly on a threshold: a mean guest rating of at least 4.8 stars. Most existing research asks what the badge is worth, and price estimates in that literature disagree, even in sign. This project asks the prior question: what can the rating behind that threshold actually tell apart? It also asks what the badge is associated with in price, and whether a causal effect of Superhost status is identifiable at all.
The analysis covers every US market published by Inside Airbnb — 31 markets and 186,873 listings from June 2026 snapshots — plus six-wave quarterly panels for the three markets with enough archive depth: Austin, Washington DC, and Hawaii.
Findings
A rating can’t reliably sort listings
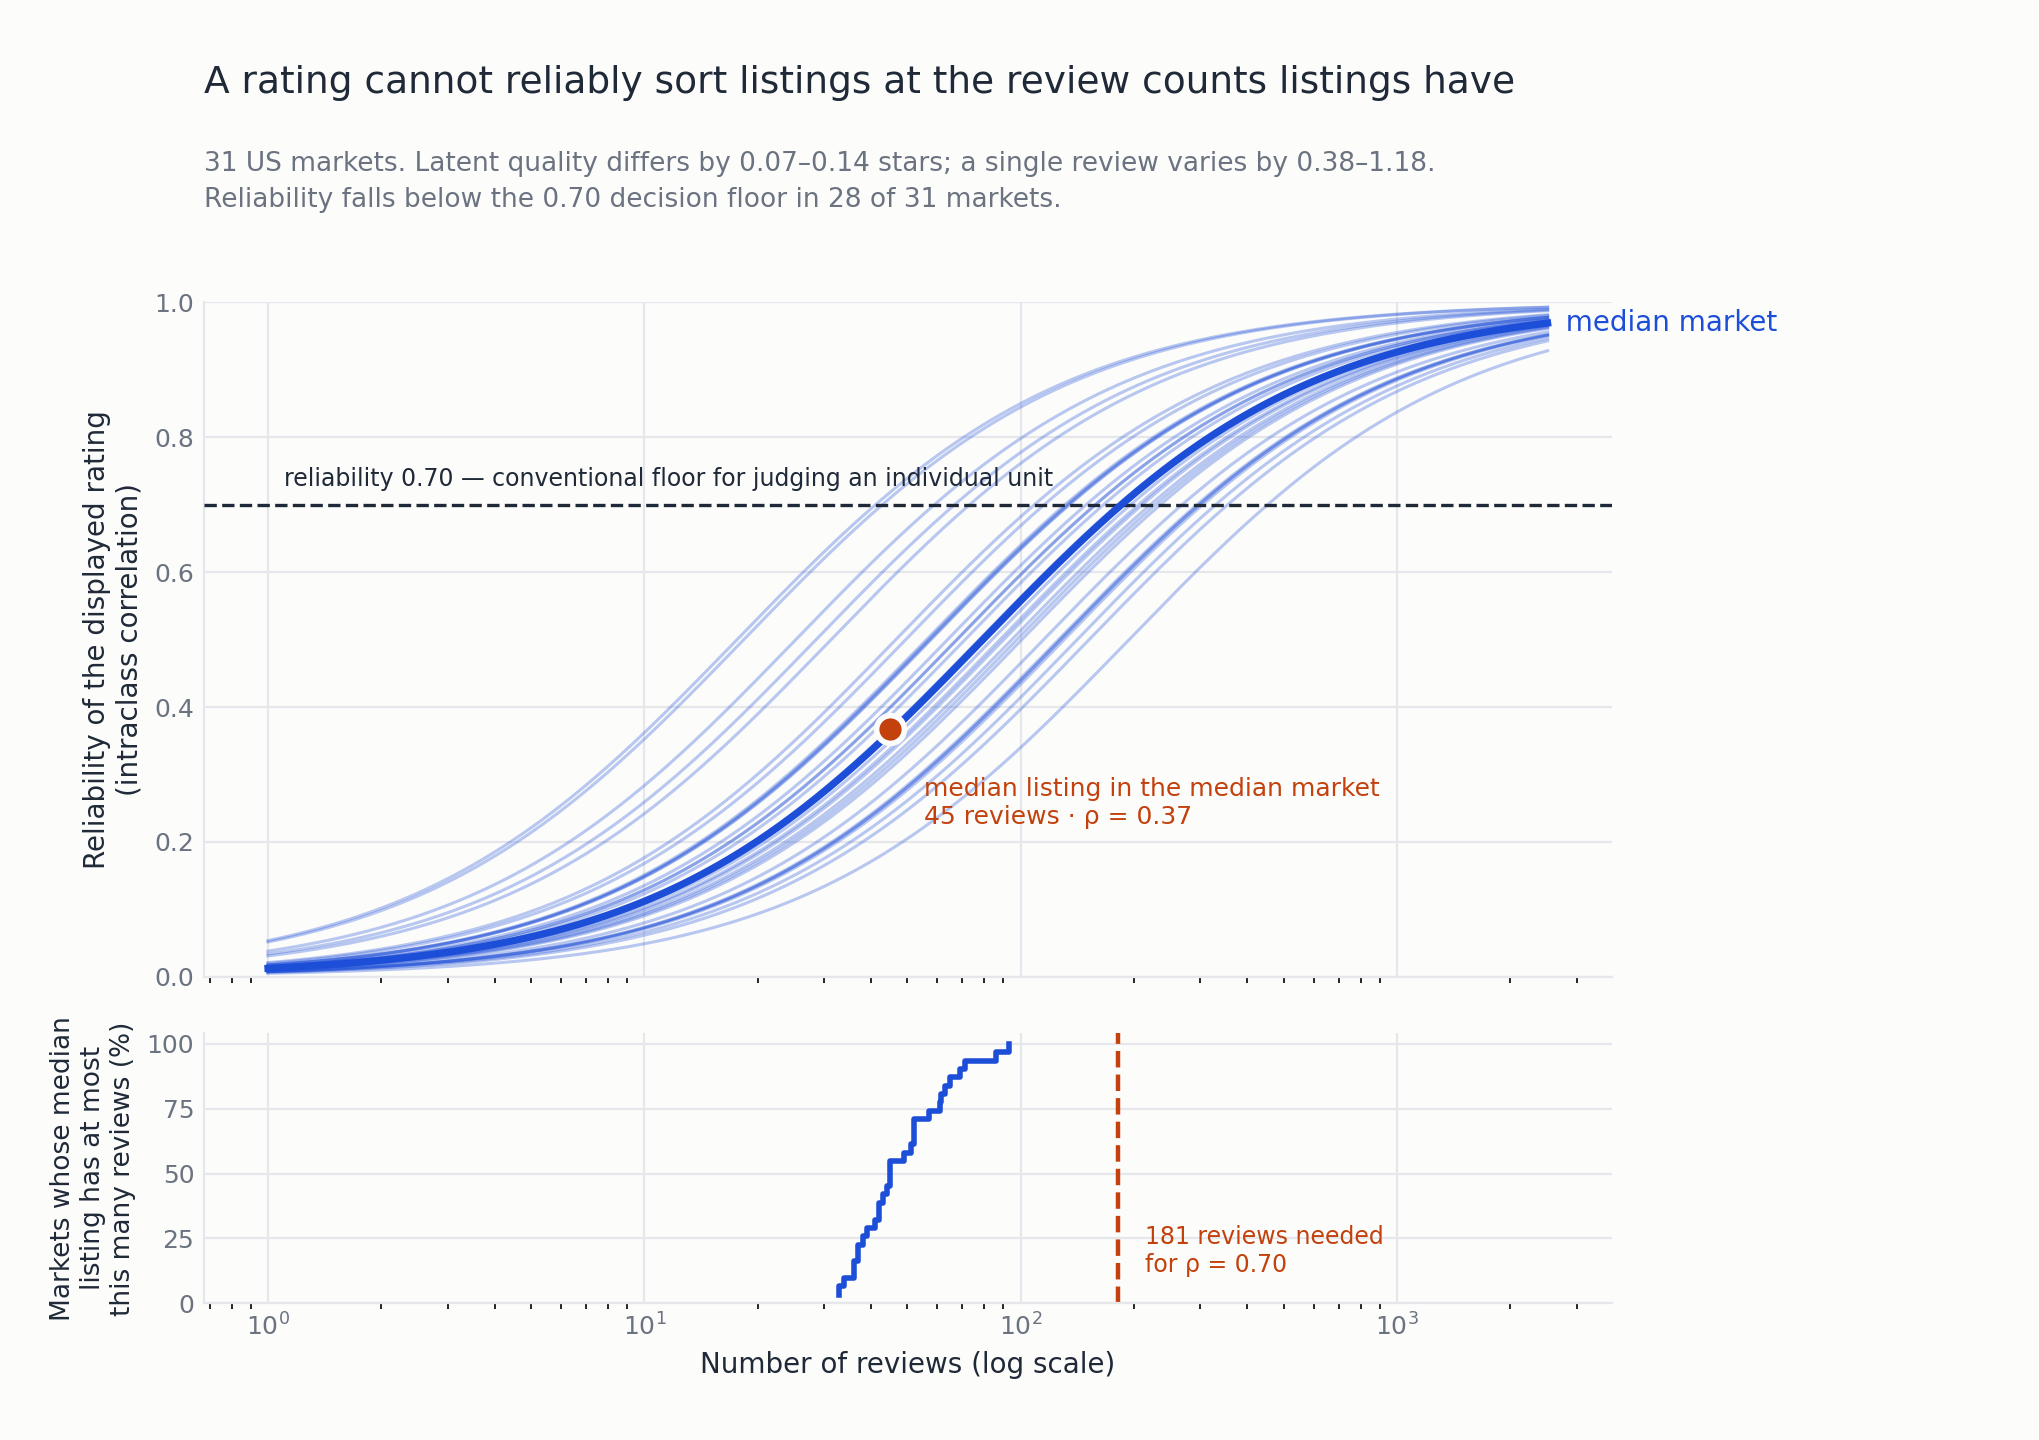
Reliability at the median listing is 0.37, below the conventional 0.70 floor in 28 of 31 markets. Latent quality differs between listings by only 0.07–0.14 stars, while a single review varies by 0.38–1.18 stars. Reaching a reliability of 0.70 would take 181 reviews; the median listing has 45.
Which side of 4.8 a listing lands on still matters
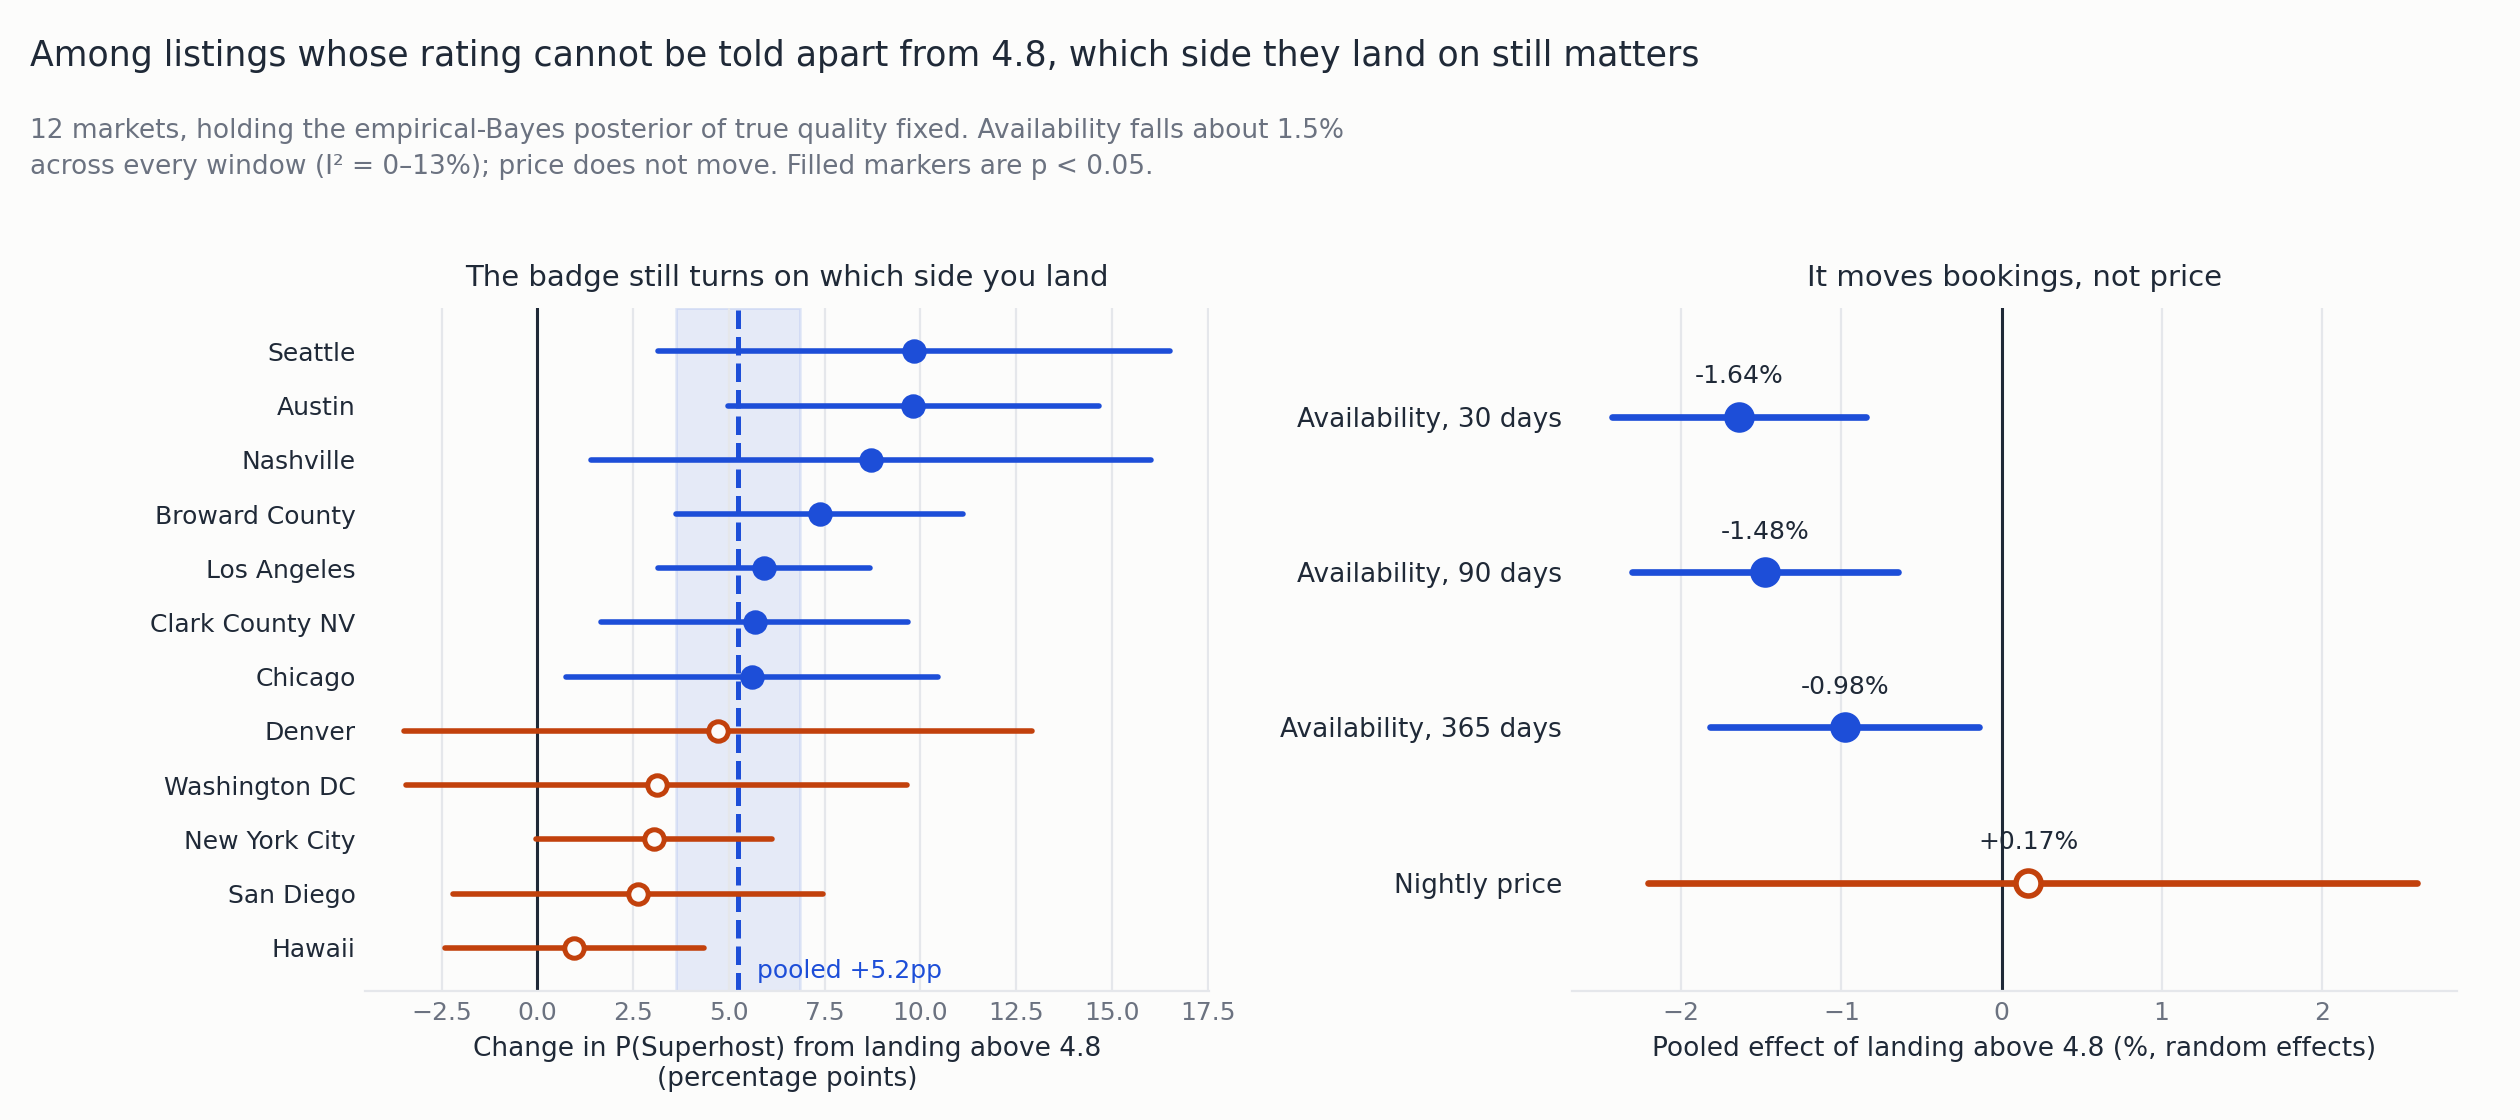
Among listings whose rating can’t be statistically told apart from 4.8, landing above it raises the chance of holding Superhost status by 5.2 percentage points and cuts availability by about 1.5% — but price doesn’t move.
The price premium is mostly composition
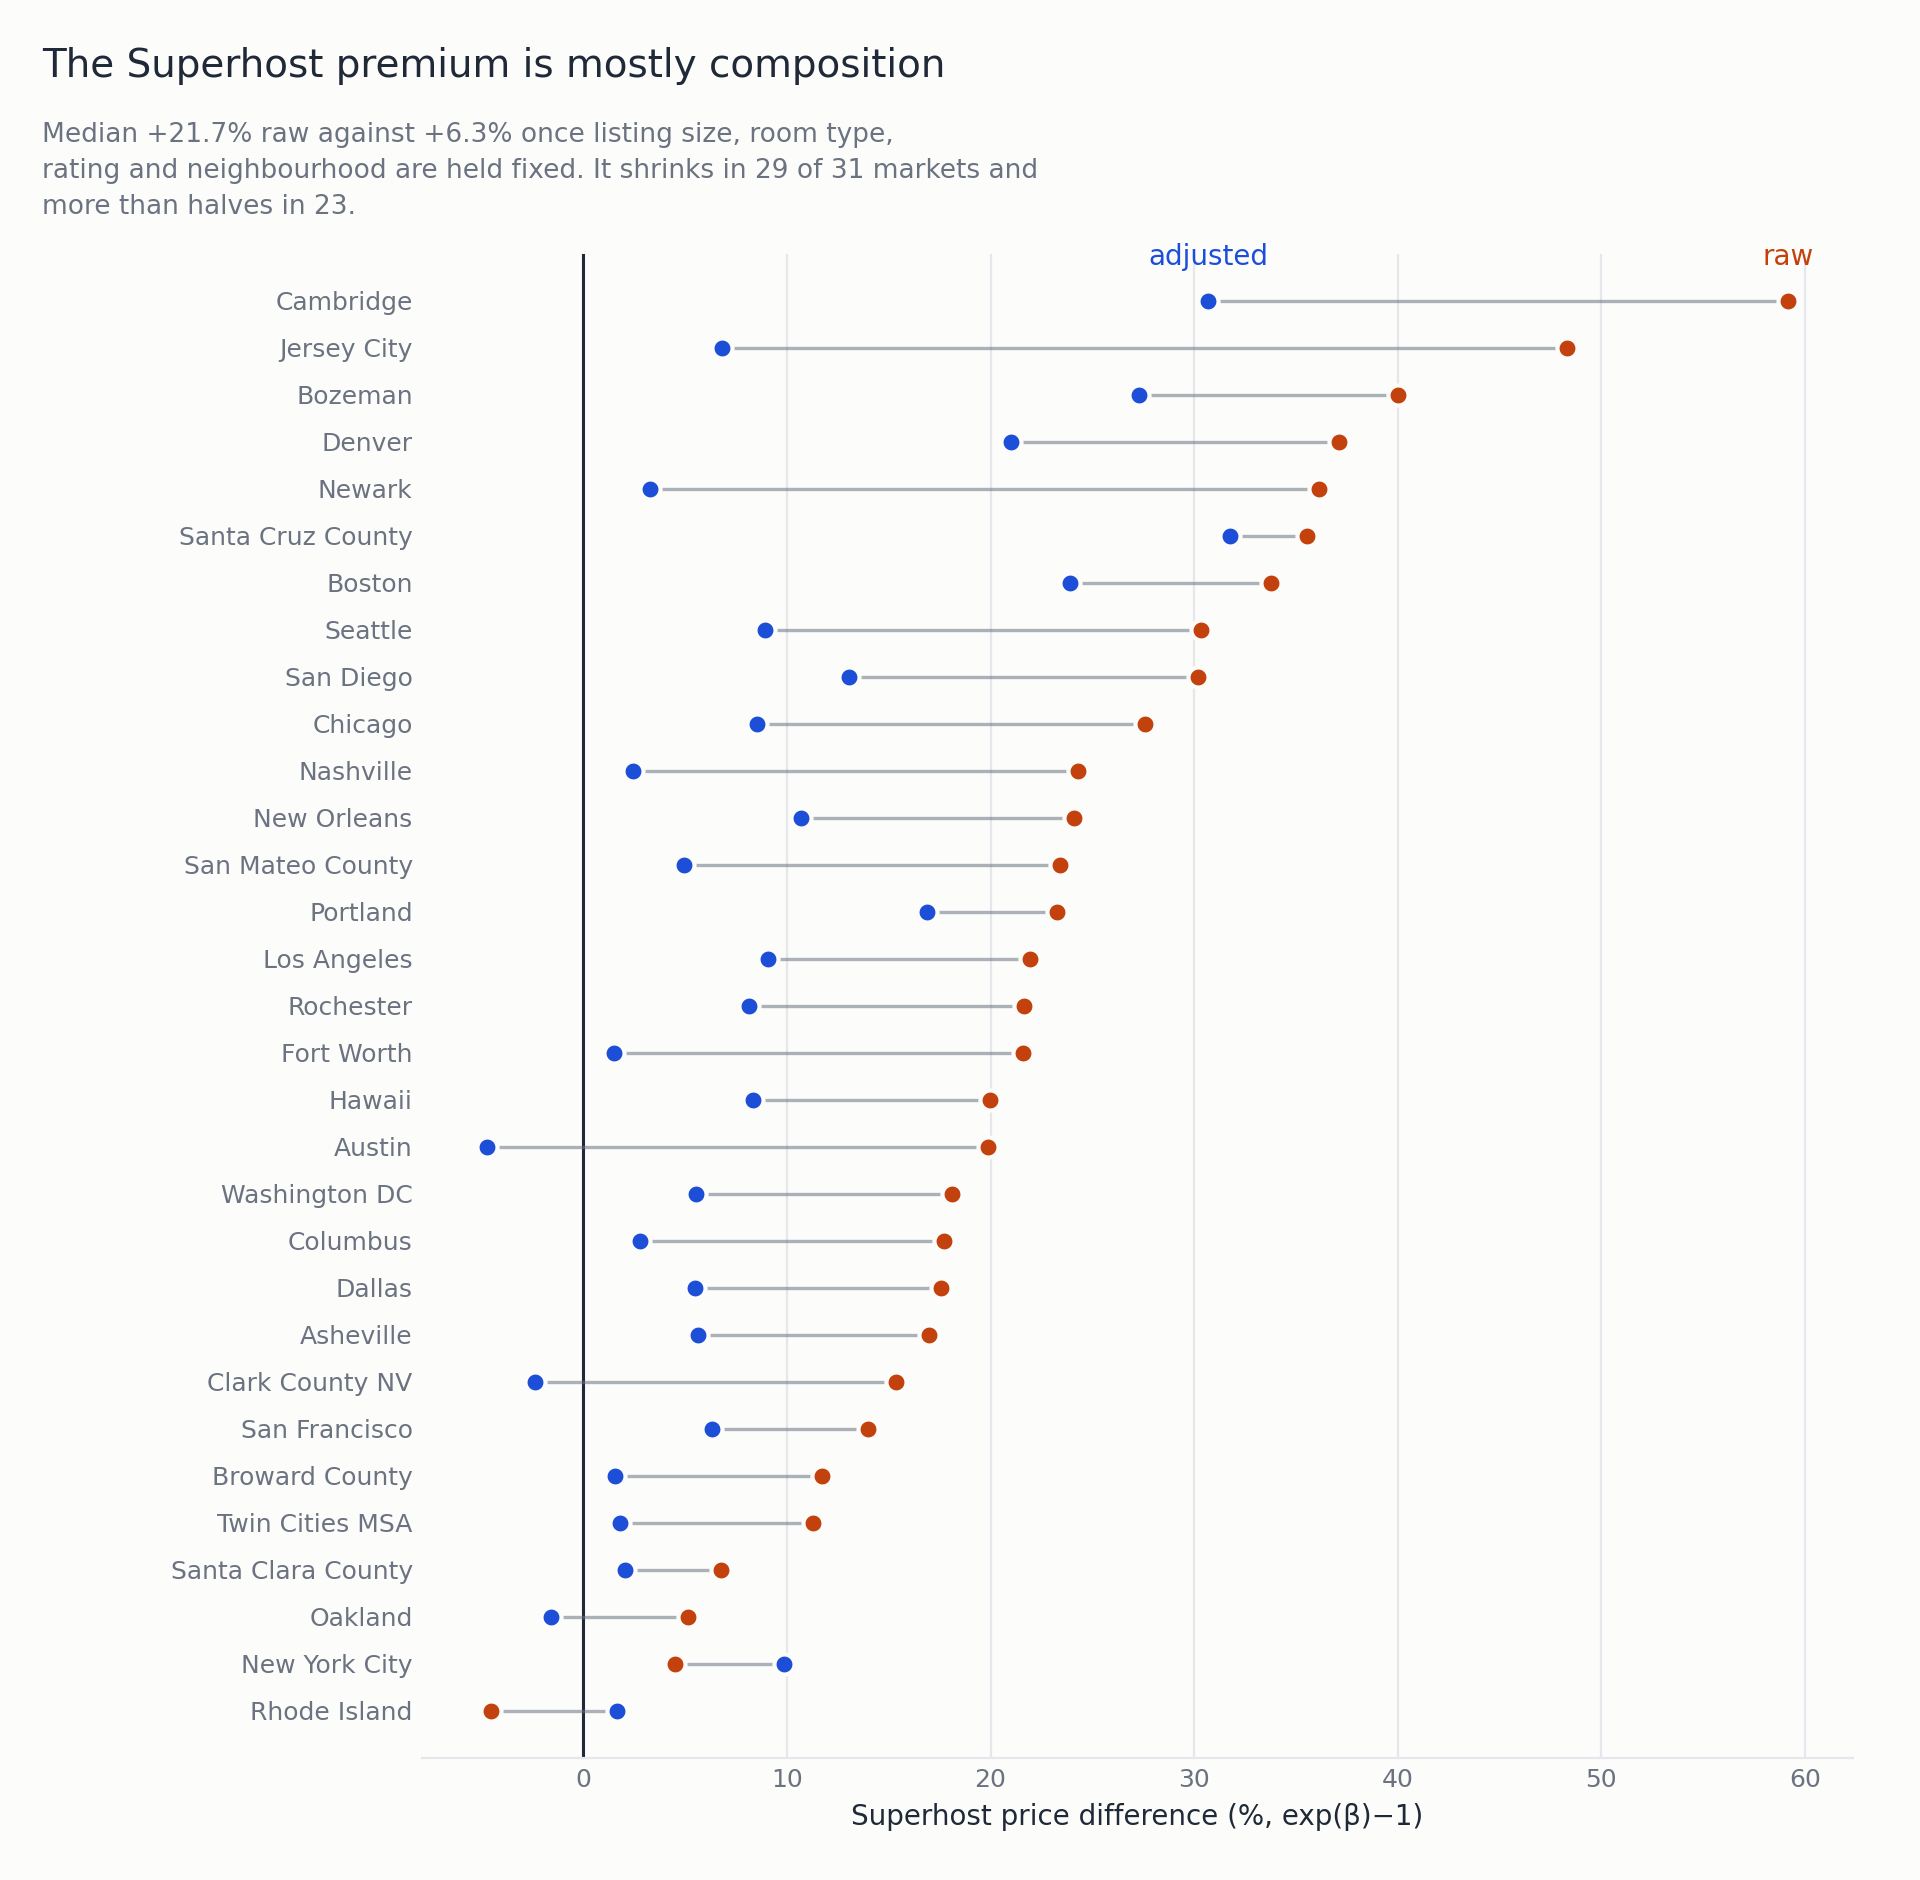
The median raw Superhost price gap of +21.7% falls to +6.3% once listing size, room type, rating, and neighborhood are held fixed. It shrinks in 29 of 31 markets.
The causal effect isn’t identified
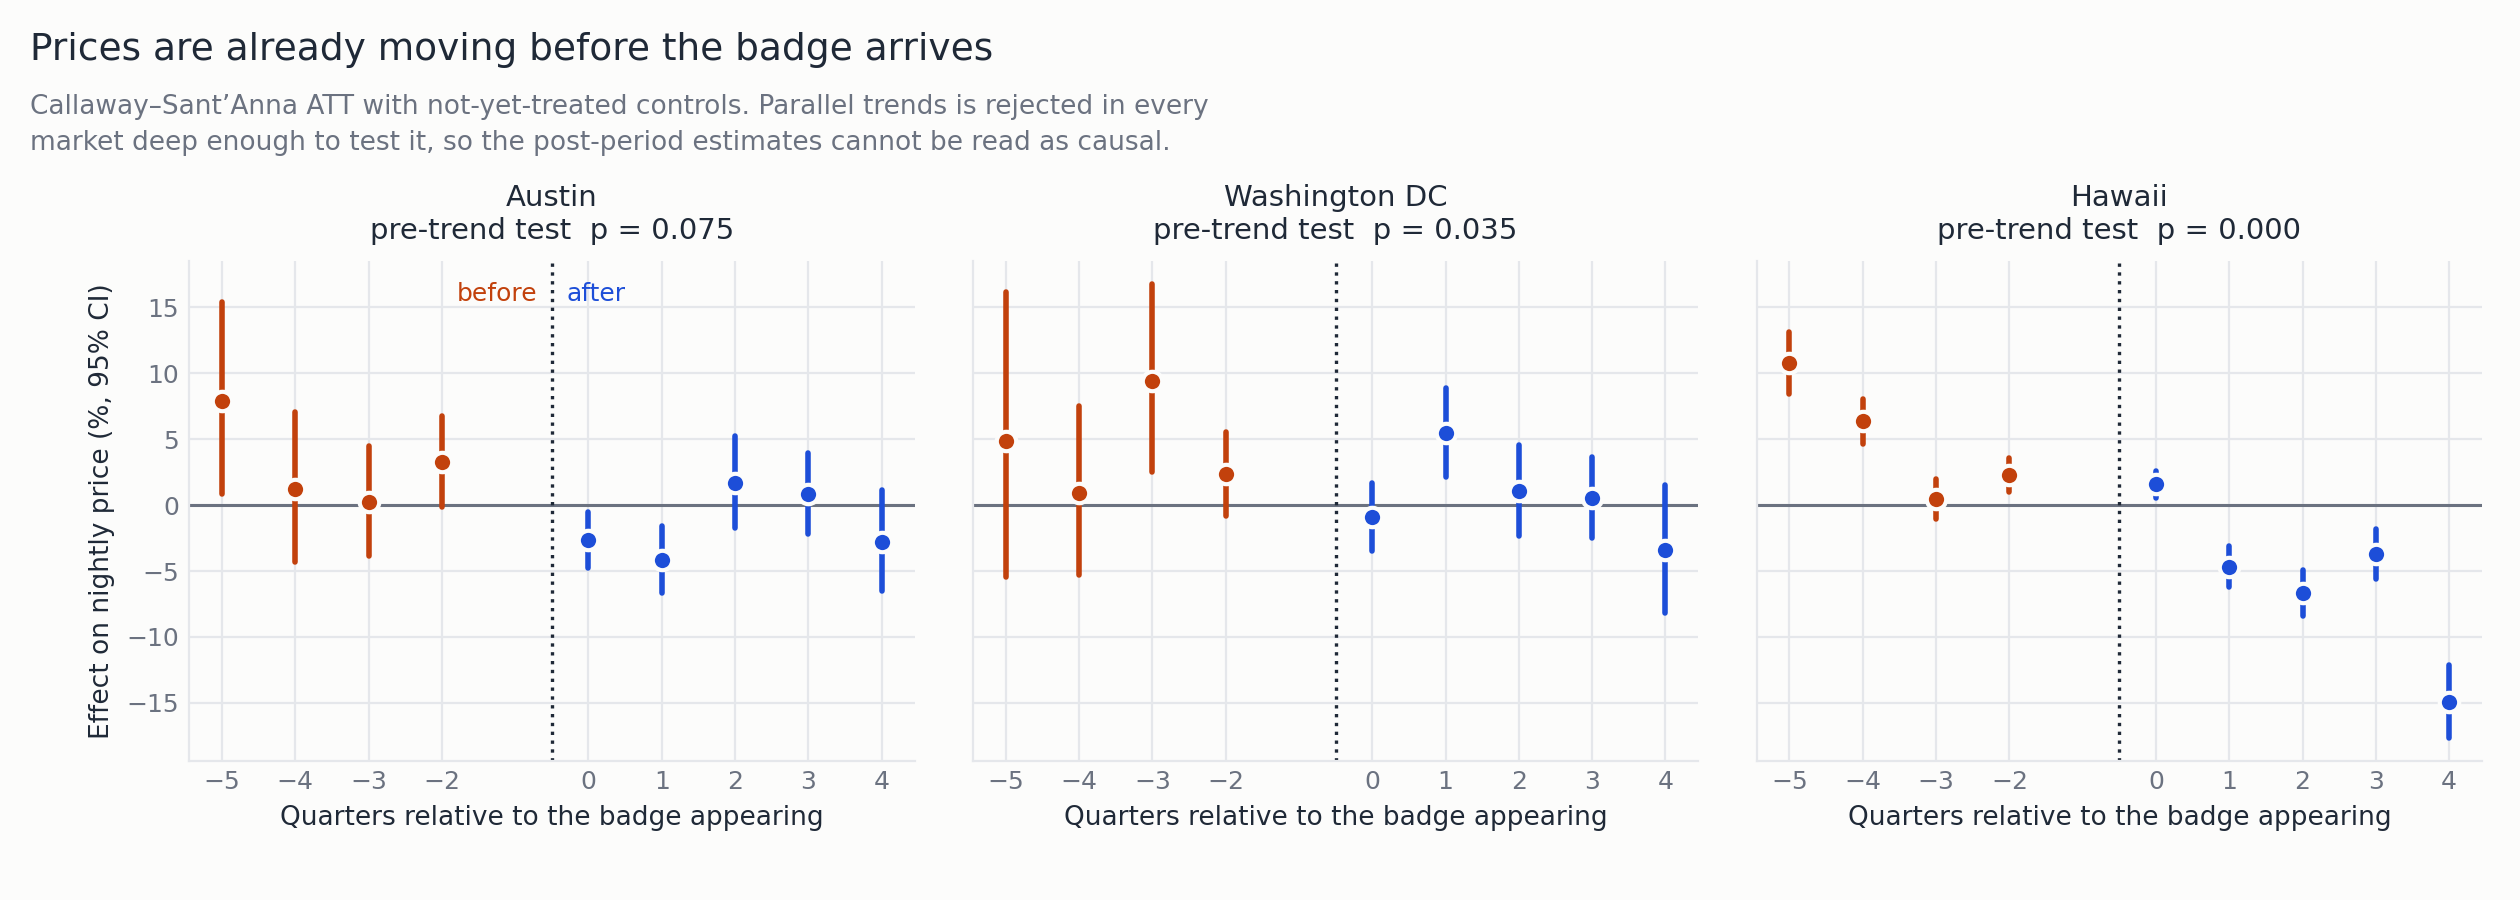
A within-listing event study fails its pre-trend test in DC and Hawaii, and is marginal in Austin — so the post-badge estimates can’t be read as causal.
Rejected: noise explains the specification swing
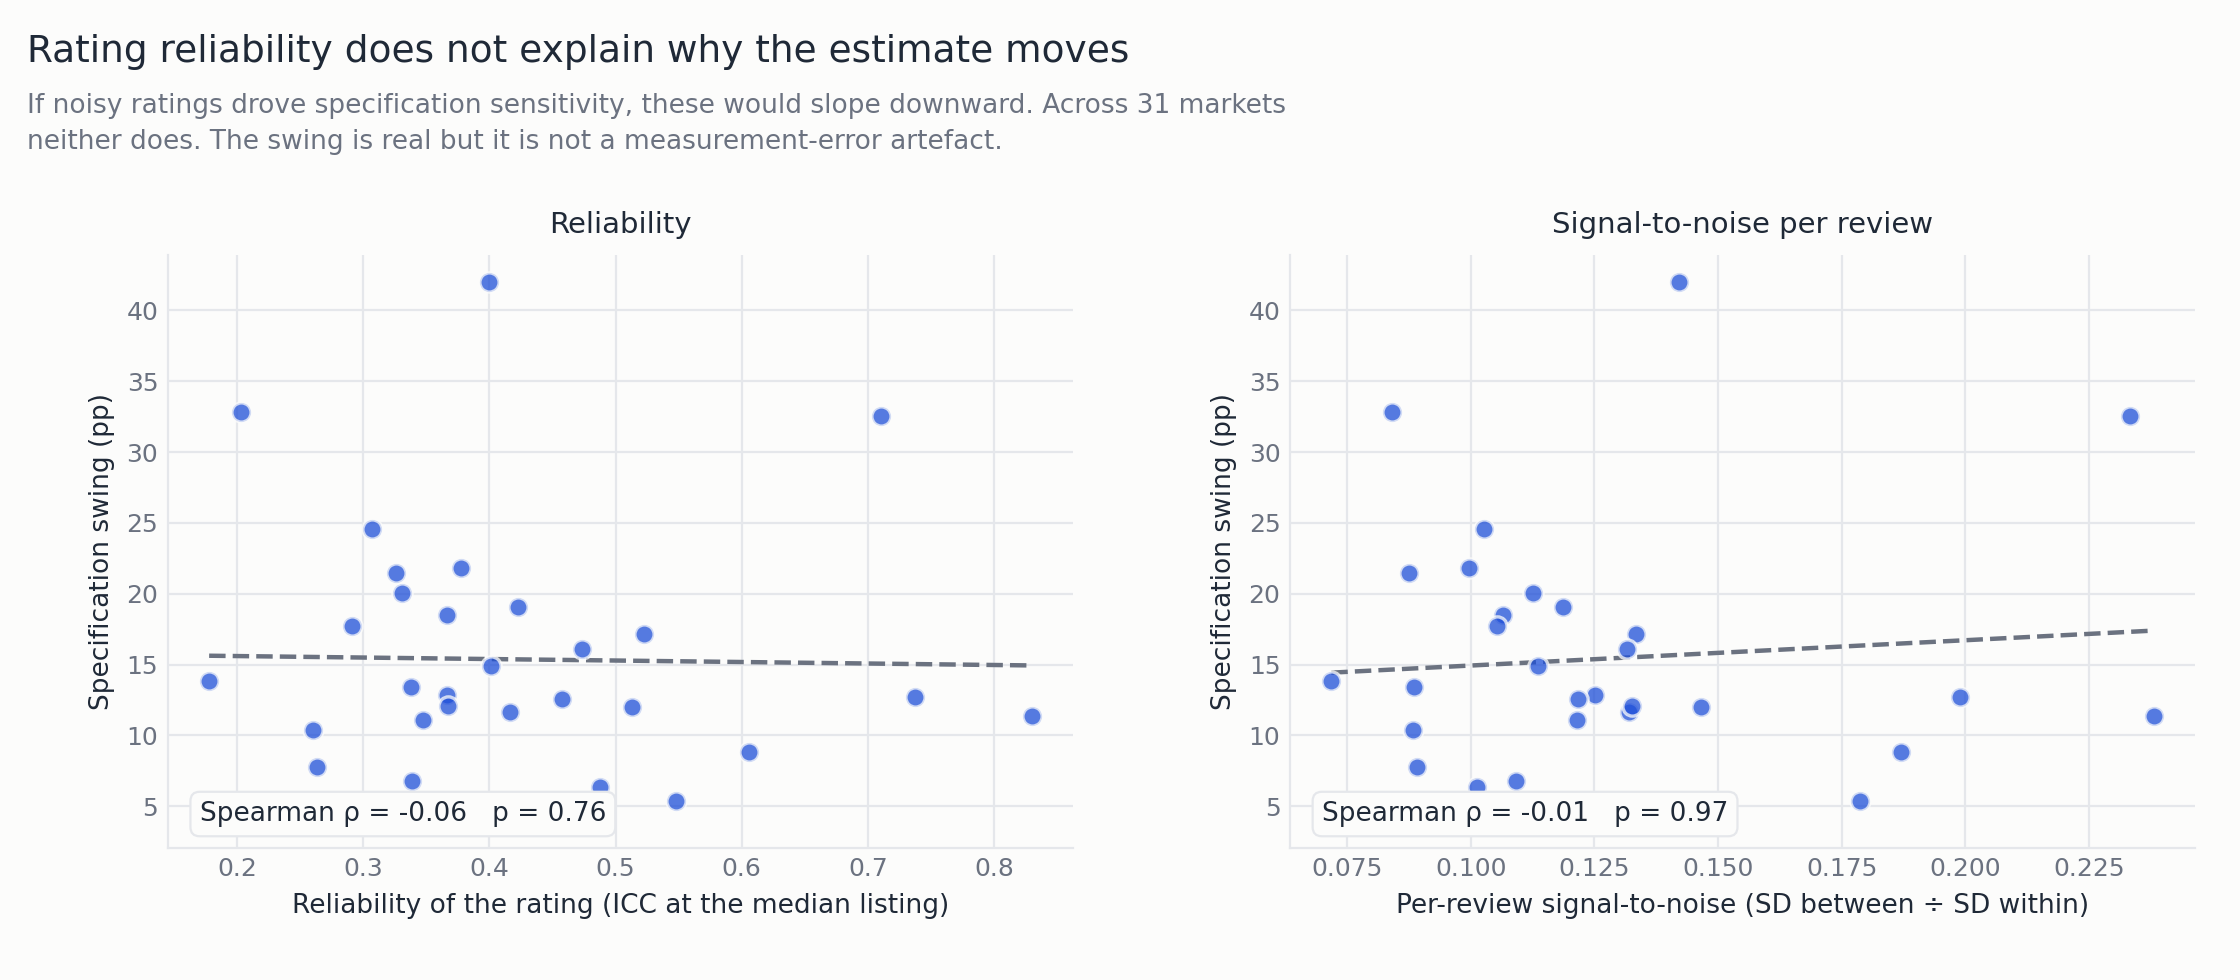
The project began with the hypothesis that noisy ratings explain why price estimates swing with model specification. Across all 31 markets, that link fails (Spearman ρ = −0.06, p = 0.76) — reliability doesn’t predict how far an estimate moves across specifications.
The project also surfaced three undocumented defects in the Inside Airbnb data itself (null prices in one month, a silent redefinition of the price field, and unstable listing composition over time), and validated its own reliability measure against Airbnb’s seven rating sub-scores.
Status
The analysis pipeline is complete and reproducible, with every reported number traced back to code. The project is now in preparation for submission.